Filtration as the Race of the Tortoise and the Hare
The classic fable of the Tortoise and the Hare can be applied to industrial filtration principles, particularly when understanding precoat filtration. , differential pressure, and flow rate optimization.
The Role of Precoat – The Hare’s Job
Imagine a one-mile race on a four-lap track. Before the race
begins, the track must be properly conditioned—this is
equivalent to precoat formation in a filtration system.
The Hare, known for its speed, represents the
precoat phase, rapidly preparing the surface for
efficient filtration.
Just as a poorly prepared track will slow down
runners, a hasty or uneven precoat layer can lead to
early filter media blinding, requiring premature cycle
termination.
Precoat flux rates should be higher than operational flux rates to ensure uniform formation without compaction. Precoat at a flux rate > 1 gpm/ft2.
Application :
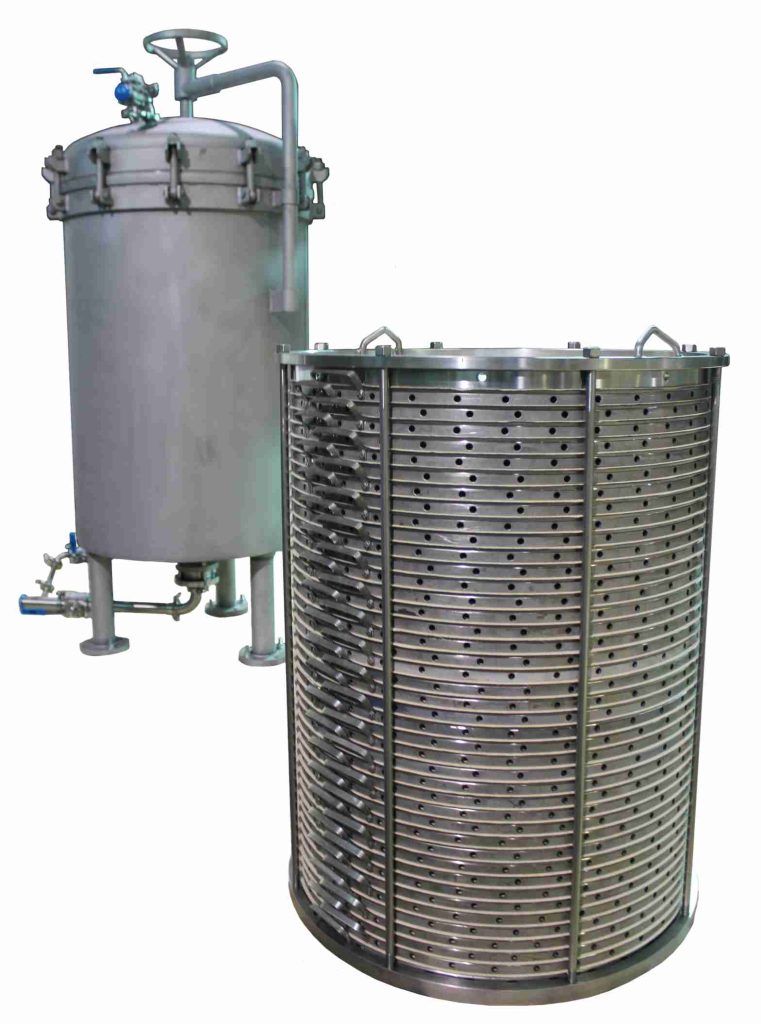
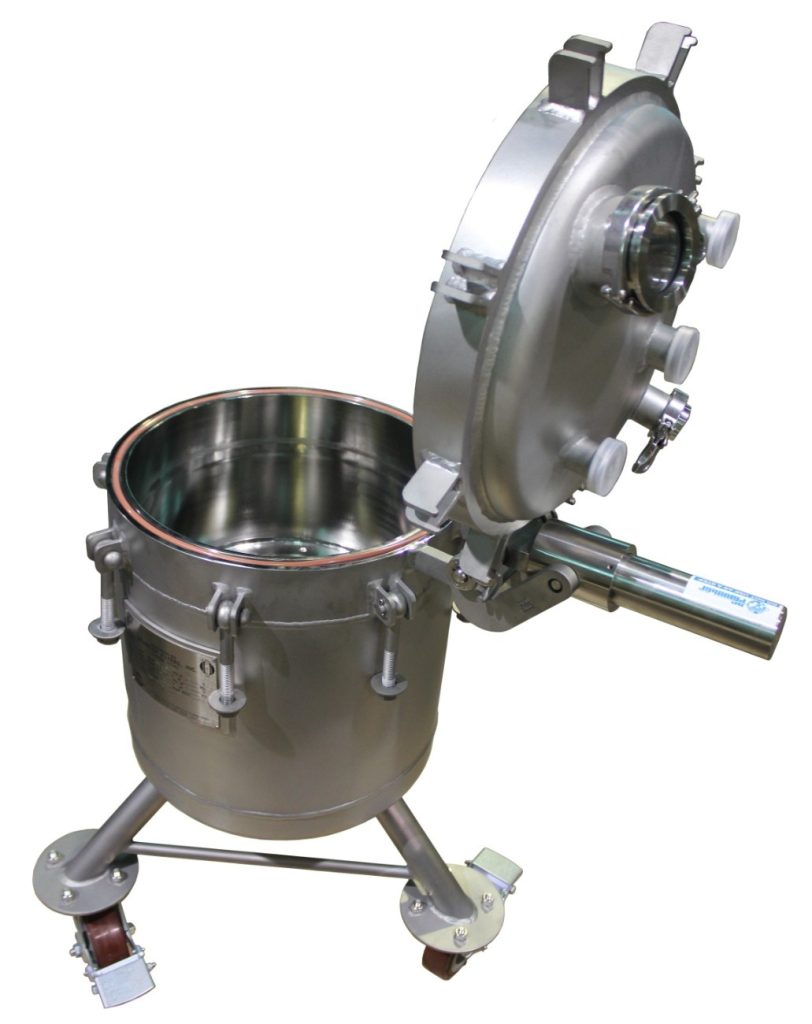
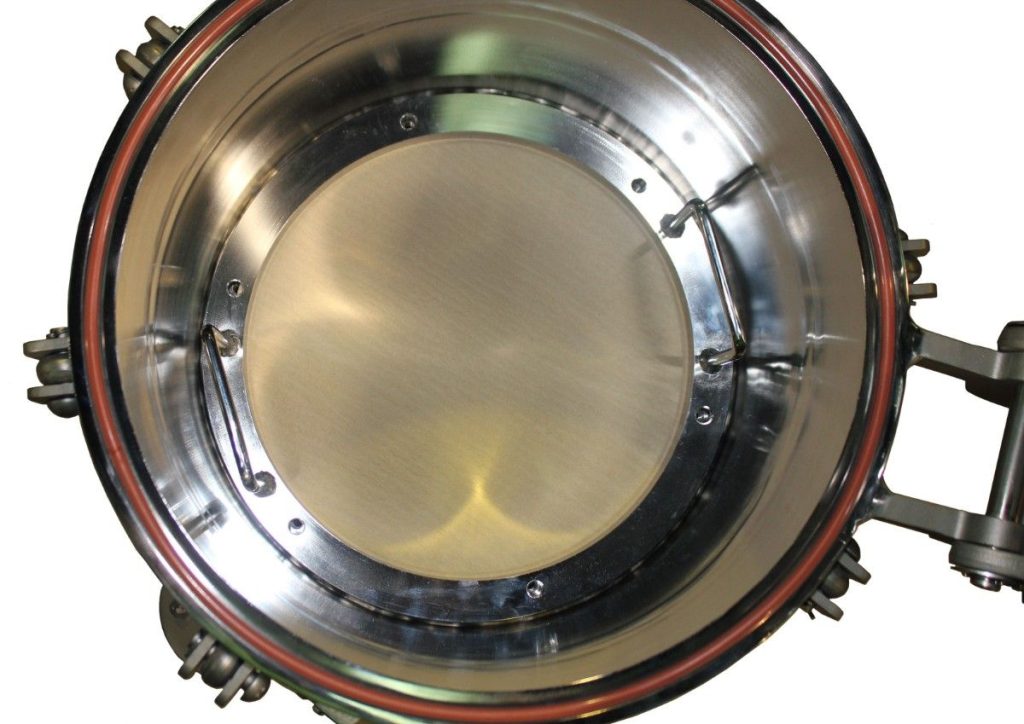
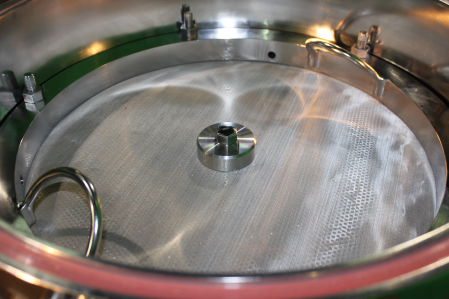
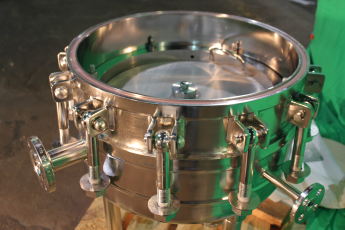
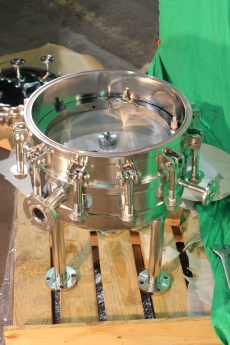
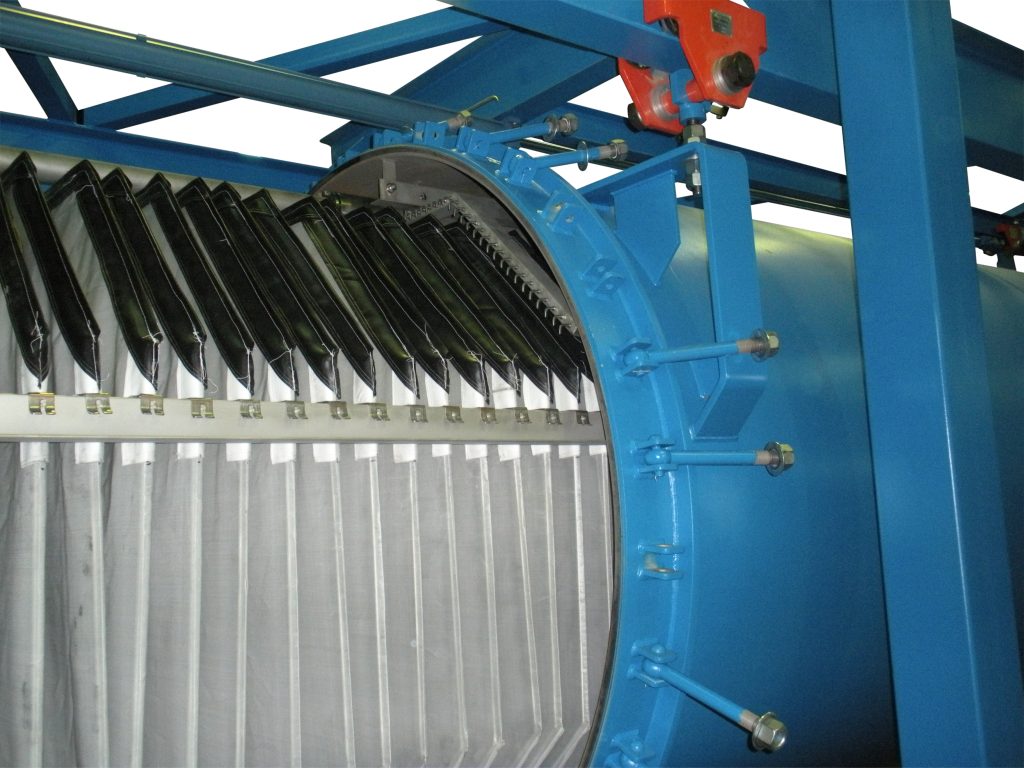
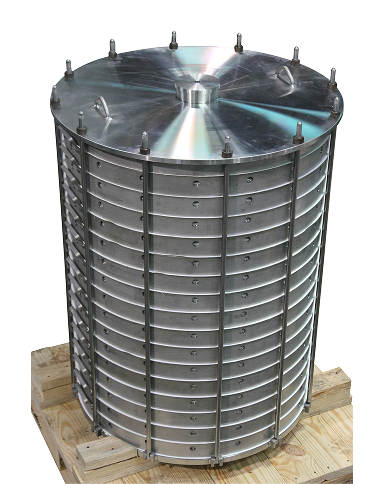
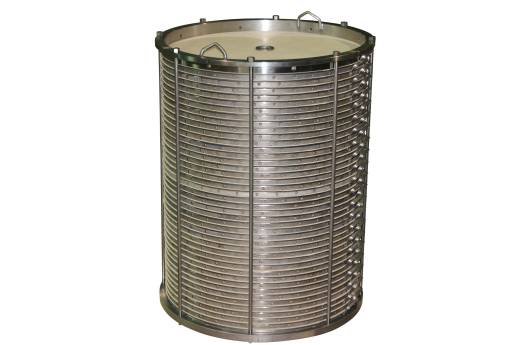
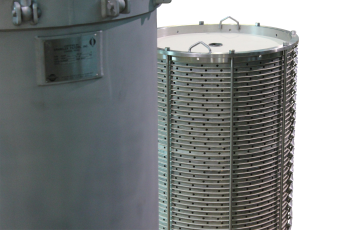
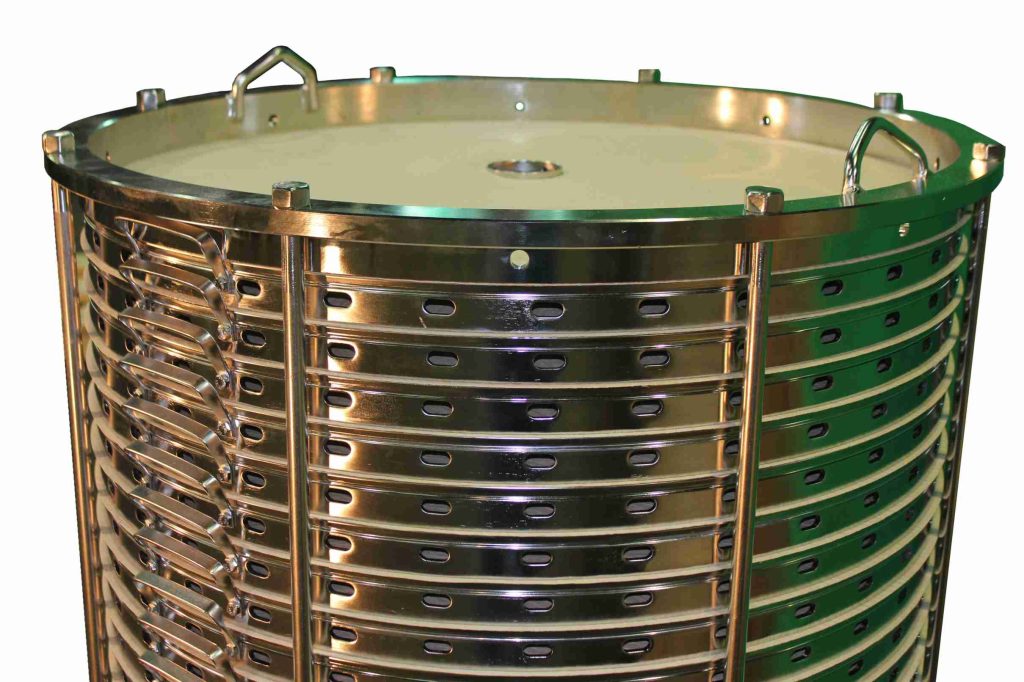
A properly formed precoat will take the ~50% open area from
wire mesh or other media and convert it to a porous depth
filter of >90% functional filter area. A well-formed precoat
should have a consistent differential pressure (dP) and match
historical data. If the precoat pressure drop does not match
expectations, it signals uneven deposition, improper dosing
of filter aid, or premature compaction.
The Graph of Efficiency – Finding the Optimal Curve
Just as a race strategist maps out pace goals, filtration
engineers must graph differential pressure vs. flow rate to
find the optimal operating curve.
If you begin the first lap of filtration at a high flux rate, you have spent driving force and created pressure differential. The flow rate at a given differential pressure will never increase.
Each system has a minimum flux rate for precoat
formation and a maximum flux rate for main filtration.
Beyond a certain ΔP threshold (typically 15 PSI for most cake filtration applications), further increases in driving force yield diminishing returns, causing exponential flow resistance growth.
Application :
Graphing historical dP vs. cycle time allows operators to
predict when the system will reach its optimal endpoint,
preventing excessive compaction and ensuring consistent
throughput across cycles. Click here to download a simple
example batch log.
Controlling Driving Force – The Tortoise’s Race Strategy
When the race begins, the Tortoise represents the main
filtration phase, where steady, controlled flow leads to
optimal performance.
If the Hare sprints too fast (high initial flow rate), it burns out early, just as an overly aggressive initial flow rate in filtration can lead to rapid pressure drop escalation and premature cycle termination.
In constant-rate filtration, the applied pressure must be carefully controlled, as increasing flow beyond a sustainable rate does not improve throughput—it instead accelerates resistance buildup and reduces efficiency.
Application :
Operators must balance flow rate vs. pressure drop to
maintain optimal filtration efficiency. Excessive driving force
(ΔP beyond 15 PSI) significantly reduces effective filter area,
increasing resistance and reducing cycle time
Measuring Efficiency – The Functional Filter Area Concept
The key to process stability is the ability to measure and
track precoat performance over time.
Each cycle should ideally match historical precoat time, effectiveness, and initial dP.
If there are variations in these values, engineers must
investigate:
Why is precoat pressure drop inconsistent?
Is there a loss of functional filter area due to clogging
or cake collapse?
Are there changes in solids loading affecting
performance?
Application :
Consistent cycle-to-cycle monitoring helps detect small
efficiency losses before they escalate into process failures.
Pressure Drop Monitoring :
A Diagnostic Tool
Monitoring differential pressure (DP) is one of the easiest ways to understand what's happening inside your filter system.
For reusable media :
A fresh bag might start at 2 psid.
Over time, DP slowly climbs. If you start a cycle at 10 psid, you’re running reduced flow or getting faster blinding—time to replace the bags.
If DP drops suddenly between cycles without a bag change (e.g., 10 to 5), you may have: